Passing Google’s Core Web Vitals is no longer an optional technical experiment—it is a confirmed organic ranking factor, a direct driver of mobile conversion rates, and the baseline requirement for maintaining high Google Ads Quality Scores. Yet over 60% of eCommerce and corporate websites fail on mobile devices due to preventable render-blocking scripts, un-optimized hero media, and unreserved layout shifts.
This comprehensive guide breaks down the science of Core Web Vitals in plain English, examines why real-world field data differs from synthetic lab tests, and delivers actionable, engineering-backed strategies to bring your Largest Contentful Paint (LCP), Interaction to Next Paint (INP), and Cumulative Layout Shift (CLS) into the green zone.
The 2026 Core Web Vitals Standards Explained
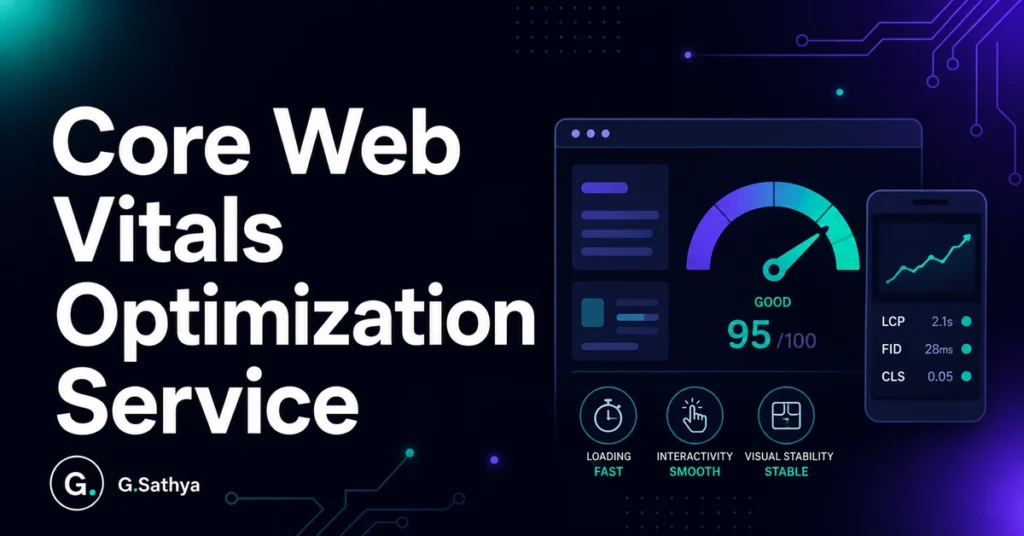
Google evaluates user experience based on three specific real-user metrics known as Core Web Vitals. Rather than measuring total page weight or raw download speed, these metrics quantify how quickly content becomes readable, how fast the page responds to taps and clicks, and how visually stable elements remain during browsing.
| Metric | Measures | Good (Pass) | Needs Improvement | Poor (Fail) |
|---|---|---|---|---|
| LCP (Largest Contentful Paint) | Loading Speed (Main Hero/Banner) | ≤ 2.5 seconds | 2.5s – 4.0s | > 4.0 seconds |
| INP (Interaction to Next Paint) | Interactivity & Responsiveness | ≤ 200 ms | 200 ms – 500 ms | > 500 ms |
| CLS (Cumulative Layout Shift) | Visual Stability (Layout Jumps) | ≤ 0.10 | 0.10 – 0.25 | > 0.25 |
A crucial distinction that confuses many site owners is the difference between Lab Data (such as synthetic Lighthouse audits or PageSpeed Insights scores on a single test run) and Field Data (the Chrome User Experience Report / CrUX). Google’s ranking algorithm solely evaluates field data collected from real Chrome visitors over a rolling 28-day window. To pass Google Search Console’s Core Web Vitals audit, at least 75% of your page visits across both mobile and desktop must hit the “Good” threshold.
1. Largest Contentful Paint (LCP): Diagnosing and Fixing Slow Renders
LCP marks the point in the page timeline when the main content block—usually a large hero image, a video poster, or a dominant H1 heading block—has finished rendering on the visitor’s screen. If your LCP takes longer than 2.5 seconds on a simulated mobile 4G connection, your visitors experience perceived slowness and bounce before reading your value proposition.
The Four Components of LCP
To optimize LCP systematically, you must identify which of its four sub-parts is bottlenecking your score:
- Time to First Byte (TTFB): The time it takes for your hosting server to return the initial HTML document. Ideally under 600ms.
- Resource Load Delay: The gap between the first byte arriving and the browser discovering the LCP image or asset. Ideally zero.
- Resource Load Duration: The actual time required to download the LCP asset over the network.
- Element Render Delay: The delay between the image downloading and the browser actually painting it onto the screen (usually caused by render-blocking CSS or JavaScript).
Actionable Strategies to Fix LCP
1. Prioritize the Hero Image with fetchpriority
Browsers parse HTML sequentially. If your hero image is discovered late in the document, the browser will wait before queueing the download. By assigning fetchpriority="high" and disabling lazy loading on above-the-fold assets, you command the browser engine to fetch the hero image with maximum network urgency:
<!-- Never lazy-load the above-the-fold hero image -->
<img src="hero-banner.webp"
     fetchpriority="high"
     loading="eager"
     decoding="async"
     width="1200"
     height="630"
     alt="Core Web Vitals Optimization">
2. Preload Critical Web Fonts
If your LCP element is a prominent headline rather than an image, font-swapping delays will stall your LCP paint. Preload the primary brand font weight in your document <head> so the typography renders simultaneously with HTML parsing:
<link rel="preload"
      href="/assets/fonts/inter-bold.woff2"
      as="font"
      type="font/woff2"
      crossorigin>
3. Eliminate Server-Side TTFB Delays
Shared hosting servers with un-cached database queries frequently take 1.2 to 2.5 seconds just to emit the first byte of HTML. Implementing server-level caching (such as LiteSpeed Cache, NGINX FastCGI Cache, or Cloudflare Automatic Platform Optimization) serves static HTML directly from high-speed memory in under 150ms.
2. Interaction to Next Paint (INP): Mastering Interactivity
In March 2024, Google permanently retired First Input Delay (FID) and replaced it with Interaction to Next Paint (INP). While FID only measured the response delay of the very first click, INP assesses the latency of every single tap, click, and key press throughout the user’s entire session, recording the worst latency as your score.
What Triggers Poor INP?
INP bottlenecks occur when user interactions arrive while the browser’s main thread is locked executing long JavaScript tasks (> 50ms). When a shopper clicks “Add to Cart”, taps an accordion FAQ, or opens a mobile hamburger menu, the browser cannot paint the visual feedback until the current script finishes executing.
How to Reduce Main Thread Blocking for INP
- Audit Heavy Third-Party Trackers: Marketing pixels (Google Tag Manager, TikTok Pixel, Hotjar, Klaviyo, Meta Pixel) flood the main thread during initial load. Defer tracking beacons or load them using Web Workers via libraries like Partytown.
- Break Up Long JavaScript Tasks: Avoid giant synchronous functions that monopolize the CPU for 150ms+. Break complex data calculations into asynchronous microtasks using
setTimeout()or modernscheduler.yield()APIs so user clicks can jump the queue. - Debounce Heavy Event Listeners: Search inputs, live filters, and scroll listeners should be debounced with requestAnimationFrame to prevent multiple expensive DOM recalculations from stacking on mobile processors.
- Eliminate Heavy Slider and Animation Plugins: Replace heavy jQuery sliders (like Slick or Owl Carousel) with lightweight, modern CSS scroll-snap containers that run on the compositor thread without touching the JavaScript main thread.
3. Cumulative Layout Shift (CLS): Eradicating Visual Jumps
Nothing frustrates a website visitor more than attempting to tap a link, only for an unannounced banner or late-loading image to push the page downward, causing them to click the wrong button or lose their reading position. Cumulative Layout Shift (CLS) quantifies the sum total of all unexpected layout shifts that occur during the page lifecycle.
The 3 Most Common Causes of CLS and Their Fixes
1. Images and Videos Without Explicit Aspect Ratios
When a browser downloads HTML, it doesn’t know the dimensions of an image until the image file itself is fetched. If no dimensions are specified, the container starts at 0px tall and abruptly expands to 400px when loaded, shoving all subsequent content downward.
The Fix: Always declare explicit width and height attributes on all images, SVGs, and iframe embeds, or define modern CSS aspect-ratio:
/* Modern CSS aspect ratio guarantees reserved space */
.hero-image {
  width: 100%;
  height: auto;
  aspect-ratio: 16 / 9;
}
2. Dynamic Promotional Banners & Sticky Announcements
Injecting top promotional banners, cookie consent popups, or currency switchers into the top of the DOM after JavaScript loads will instantly cause a severe CLS penalty.
The Fix: Statically render banner containers in the initial HTML document with reserved minimum height (e.g. min-height: 48px), or overlay announcement modals using fixed position rather than relative DOM pushing.
3. Flash of Unstyled Text (FOUT / FOIT) from Web Fonts
When an external font loads late, the browser initially displays the fallback font (like Times or Arial), and then abruptly snaps to the custom web font when downloaded. If the two fonts have different letter-spacing or line-heights, the entire paragraph reflows.
The Fix: Use font-display: swap combined with matching CSS fallback font metrics (using tools like Fontaine or Next.js font optimization), or utilize font-display: optional for non-critical body fonts.
Real-World Core Web Vitals Audit Checklist
Before commissioning an expensive theme rebuild, run through this comprehensive engineering checklist to diagnose quick wins across your technology stack:
| Optimization Target | Primary Metric | Standard Impact | Implementation Effort |
|---|---|---|---|
| Enable Server-Side HTML Page Caching | LCP (TTFB) | -800ms to -1.5s | Low (Hosting / Plugin) |
| Preload Above-The-Fold Hero Image | LCP | -400ms to -900ms | Low (Theme code) |
| Convert Images to WebP / AVIF Formats | LCP / Total Weight | -30% to -60% size | Medium (Automated pipeline) |
| Defer Non-Critical JavaScript (GTM / Pixels) | INP | -150ms to -400ms | Medium (Tag governance) |
| Set Explicit Dimensions on Images & Banners | CLS | Brings CLS < 0.05 | Low (HTML attributes) |
| Eliminate Render-Blocking Google Fonts | LCP / FCP | -300ms to -600ms | Low (Self-host / Preload) |
| Purge Unused CSS & Minify Assets | FCP / LCP | -200ms to -500ms | Medium (Build tools) |
Need Guaranteed Core Web Vitals Optimization for Your Site?
If your website is losing traffic due to failed Google Search Console speed audits, I provide end-to-end technical optimization for WordPress, WooCommerce, and Shopify. I identify real bottlenecks, optimize server response, and eliminate render-blocking assets without breaking your design or third-party integrations.
Transparent rates: $30–$50 USD/hr or fixed milestone audits from $350–$650 USD. Direct communication across US, UK, European, and Australian timezones.
Frequently Asked Questions
How long does it take for Google Search Console to show green Core Web Vitals?
Google Search Console Core Web Vitals reports rely entirely on 28-day rolling field data collected from real Chrome users via the Chrome User Experience Report (CrUX). While synthetic tools like PageSpeed Insights and Lighthouse will reflect your optimizations immediately upon deployment, Google Search Console typically requires 14 to 28 days of real visitor traffic before updated field metrics graduate your URLs into the green Good status.
Can my website pass Core Web Vitals on mobile without stripping out branding or features?
Yes. Professional Core Web Vitals engineering does not mean turning your website into a plain text document or removing your brand identity. By modernizing image delivery with WebP/AVIF formats, loading above-the-fold hero elements with high priority, deferring non-essential marketing tags until user interaction, and reserving layout space for dynamic elements, your site maintains 100% of its visual polish while achieving 90+ mobile PageSpeed scores.
Why did Google replace First Input Delay (FID) with Interaction to Next Paint (INP)?
First Input Delay (FID) only measured the delay of the very first click or tap a visitor made on your site, ignoring everything that occurred after initial load. Google replaced FID with Interaction to Next Paint (INP) in March 2024 because modern web applications have continuous interactivity throughout the user journey—such as filtering products, adding items to carts, and navigating tabs. INP evaluates all user interactions across the entire session to ensure smooth responsiveness from start to finish.
Does passing Core Web Vitals directly improve organic search rankings?
Yes. Core Web Vitals is an explicit Google Page Experience ranking signal. While high-quality, relevant content remains the single most important factor for ranking, when two competing pages offer comparable content quality, Google uses Core Web Vitals as a direct tiebreaker. Furthermore, faster loading and zero layout shifts dramatically improve user engagement metrics, lower bounce rates, and increase conversion rates on mobile devices.
What is the difference between Lighthouse lab data and CrUX field data?
Lab data (Lighthouse) is measured in a controlled synthetic environment using a simulated mid-tier mobile device on a throttled 4G network. It is ideal for immediate debugging during development. Field data (Chrome User Experience Report / CrUX) represents real-world performance recorded from actual visitors on varied mobile devices, diverse network conditions, and differing geographic locations. Google Search Console rankings are based exclusively on field data.
How do third-party chat widgets and tracking tags impact Core Web Vitals?
Third-party scripts like live chat widgets (Zendesk, Tidio, Crisp), analytics trackers (Google Tag Manager, Meta Pixel), and heatmaps (Hotjar, Microsoft Clarity) are the single largest source of INP and LCP failures. When executed synchronously during initial page load, they monopolize the JavaScript main thread. By delaying the initialization of non-critical widgets until after the page has fully painted or until user interaction (scroll or touch), you prevent third-party scripts from damaging your Core Web Vitals scores.